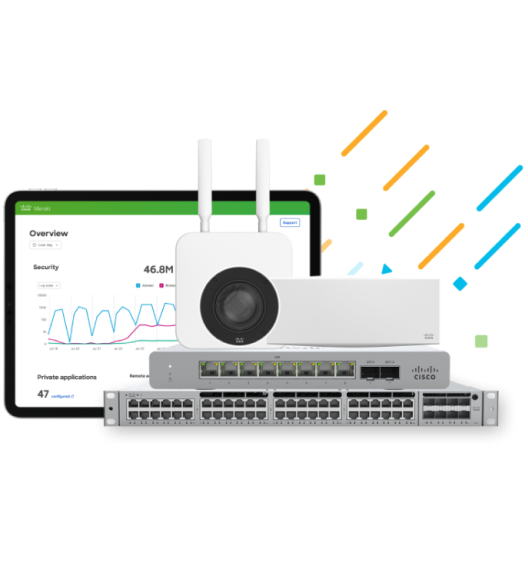
Here at Meraki, we are continually focused on simplifying the IT management experience. One of the areas our engineering team is always paying attention to is how to offer additional benefits to customers who have multiple Meraki product types. We want every product, be that wireless, security, switching or mobility management to be outstanding in their own right, but what about when they come together?
One exceptional example of this integration is Systems Manager Sentry. With Systems Manager MDM holding a wealth of data on client devices, it can automatically configure the network based on rules you provide. Another is Group Policies, where one interface allows network-wide rules, such as firewalling and traffic shaping to be configured, no matter if the connectivity type is wired or wireless.
The Meraki dashboard is central to our cloud technology and is used to manage all our products through a simple, intuitive, and powerful interface. This is continually updated and improved based on customer feedback and internal research. The cloud infrastructure allows for these changes to be seamlessly deployed without user intervention, patches, or downtime.
In February we introduced our #fullstack campaign to highlight the benefits of a combined network view in dashboard. With a combined view, the products are grouped together so that a single site can be viewed in a single navigation pane.
Although Systems Manager deployments could be managed from the same dashboard interface as the other products, it was previously not possible to combine them. Today we announce the beta availability of fully combined networks, with Systems Manager integrated into the navigation pane. If you would like to try out the new interface, go to the Organization Overview page within dashboard and choose Combine.
To celebrate the arrival of the combined #fullstack network, we are running another blog promotion for our subscribers. The winner will receive a full stack of Meraki equipment, comprising the following equipment, supplied with 3 year licences:
1 x MX64 Security Appliance
1 x MS220-8P PoE Ethernet Switch
1 x MR32 Wireless Access Point with BLE beacon technology
20 x Systems Manager licences
To take part in the promotion, all you need to do is subscribe to the Meraki blog by the end of November 2015. Current subscribers are automatically entered to win. Additional terms and conditions apply; subscription is not necessary to enter.
If you are an existing Meraki customer with only one product family today, why not try adding some of the others to learn more about the benefits of the full Meraki stack. Contact us to arrange your evaluation at no charge. You’ll be up and running in a matter of minutes, and we have a dedicated evaluation support team ready to help you at every step.
One of the most compelling benefits of cloud networking has to be the ability to troubleshoot technical issues remotely. Network engineers out there know that obtaining packet captures, an essential tool in the troubleshooting arsenal, can quickly consume time and money when supporting remote offices. Traditionally, an engineer needs to be physically present where the data is moving in order to “tap the wire” and capture detailed traffic for analysis.
In 2012 we solved this problem by giving engineers the ability to take detailed short-burst packet captures on any device in any location served by Cisco Meraki equipment. Combined with our remote cable testing feature, packet capture in the Cisco Meraki dashboard makes it far simpler to support networks on branch sites where dedicated IT resources may not be available.
The basic results of packet captures can be presented directly in the dashboard, but for more thorough data analysis, a .pcap file can be downloaded onto the engineer’s computer and opened with software like Wireshark (formerly known as Ethereal). If you haven’t worked with one before, you’ll be amazed at the detail contained in a .pcap file. It reveals everything that is passing through—from soup to nuts.
Now we’ve gone a step further and removed the need for local software by working with a new cloud service called CloudShark. Detailed packet captures can now be displayed directly in a web browser on any device.
Selecting CloudShark
Using CloudShark with Merkai is super easy. By default, any capture sent to the service is immediately viewable in the browser on CloudShark’s own website. If you’re already familiar with Wireshark, you’ll be right at home here. Here’s a sample :
Example Cloudshark Capture
If all of this detail looks overwhelming, the service includes analysis tools for helping you find that elusive needle in a haystack.
CloudShark Analysis Tools
CloudShark also offers the option to host its software locally on your own server. This provides significant additional benefits, useful in larger organizations where many captures may be taken routinely and there may be a requirement to retain this data for future use or compliance purposes. With CloudShark’s Appliance software you can
Build a searchable repository of capture files
Tag captures to associate them to a location, device or trouble/support ticket
Annotate packets and captures
Securely collaborate on encrypted packet captures
Manage user access, even integrating with LDAP/AD
Setting up an Appliance is easy, just download it and install. Add the URL and unique API token to the Cisco Meraki dashboard, and all captures will go directly from the Cisco Meraki cloud to the CloudShark Appliance, encrypted all the way from your Access Point, Security Appliance, or Switch.
We’ve got some great tools for managed services providers (MSPs) who offer Cisco Meraki’s wireless, switching, security appliance, and MDM as a service to their end customers. These tools address common MSP challenges around managing end customer networks, optimizing costs, transitioning customer networks to a hosted service quickly, and scaling those networks as needed.
Today, we’re excited to announce additional, new features for MSPs:
MSP Portal: A central location for staff to monitor all of their Cisco Meraki end customer networks over the web
Support ticketing: Create, monitor, and respond to support cases with Cisco Meraki staff
Custom branding: MSPs can brand the Cisco Meraki dashboard and summary reports to reinforce their brand message to end customers
These new features, combined with the built-in end-to-end visibility and control provided by Cisco Meraki’s cloud management platform, provide powerful ways for MSPs to keep their customer networks up-to-date and centrally managed.
MSP Portal
The new MSP portal, built into the Cisco Meraki dashboard, gives MSPs a single location to evaluate end customers’ licensing compliance and networked devices.
Easily manage licensing compliance and end customer network devices using the MSP Portal.
From the MSP portal page, click into any of your managed customer networks and use Cisco Meraki’s Live Tools to remotely troubleshoot appliances; or use the dashboard to monitor users, devices, and application traffic, set group-based policies, update licensing, and manage customers’ device inventory. You get end-to-end visibility of your customers’ networks from any Internet-accessible location—whether that’s at a NOC/SOC or your field offices.
Support ticketing
Keeping track of support cases across multiple end customer networks can be daunting, but we simplify things with a central location to create, monitor, and respond to troubleshooting tickets alongside Cisco Meraki staff. Cases are organized so that sorting cases by end customer—even down to individual customer networks—is easy.
Sort troubleshooting tickets by priority, status, case number, date created, or support engineer.
With Cisco Meraki support ticketing, you can keep track of relevant emails, files, and case descriptions for a particular problem within a single ticket and prioritize cases based on severity.
Custom branding
As the networking provider and primary support for end customers, MSPs need the ability to reinforce their brand message when administrators access the network. As part of the MSP Dashboard, Cisco Meraki will work with our partners to put a custom logo on both the main dashboard and summary emails that are sent to end customers.
Cost optimization
Reducing operational costs is a key challenge for MSPs, who must typically build out end customer network infrastructure, adjust for vendor licensing costs, and provide tech support for issues that arise. With Cisco Meraki, our cloud-hosted management infrastructure eliminates the need for MSPs to build out data centers or host wireless LAN controllers and similar infrastructure. Our simple licensing scheme, which includes all product tech support, maintenance, and feature updates, streamlines cost models. Finally, our intuitive, cloud-based dashboard allows engineers to remotely troubleshoot devices and reduces staff training hours.
On-demand scalability
It’s easy to quickly transition end customer networks to Cisco Meraki. All of our gear allows for zerotouch configuration, with no onsite IT staff needed for deployment. Adding network devices is as simple as entering an order number into the Cisco Meraki dashboard—there is no device limit, throughput limit, or backend configuration necessary. Our datacenters are designed from the ground up to scale your customers’ networks to millions of attached devices—and we have built-in redundancy across multiple geographies, all with a 99.99% uptime SLA.
If you’d like more details on these new MSP features—and additional benefits Cisco Meraki provides vis-à-vis managing end customer networks—please read our new MSP white paper.
When you get a call from a wireless user complaining about connectivity problems, what is one of the first questions you might ask? “Where are you exactly?” Knowing precisely where a user is located can be immensely helpful in diagnosing and troubleshooting issues. What AP are they associated to? Are they behind a pillar that could be blocking their wireless signal? Are they in an area of a new building where the network is currently being expanded and might still have some coverage weak spots? This knowledge can often provide an administrator with a good idea of where they should dig in to properly troubleshoot the issue.
Starting today, administrators of Meraki Enterprise networks won’t have to ask where a client is because they’ll know: introducing Meraki Location-Based Services. On each client details page you’ll notice a new map where the current location of the client is clearly indicated on either a Google map or building floorplan (see below screen shot).
In addition to troubleshooting client issues, there are many other situations where being able to pin down a client device’s location can be very useful to administrators, such as tracking down a lost laptop or monitoring a nurse’s progress doing rounds in a hospital with the medicine cart. Typically these capabilities might require additional appliances and third-party software costing $10,000’s, but with Meraki they are provided with all Enterprise networks at no additional cost and without the need to deploy additional gear.
When combined with other Dashboard features like “remote hands” tools and detailed reporting with Traffic Shaper’s application-level visibility, Location-Based Services provides administrators with powerful tools to understand exactly how their network is being used and to quickly troubleshoot client issues remotely. Please let us know what you think of this new feature using the Make a Wish box!
Meraki’s AutoRF technology performs automatic cloud-based, system-wide network optimization to ensure peak network performance in any environment. Each AP on a Meraki network continually monitors its environment for interference from other APs and feeds this information back to the Cloud Controller. Last month we added Spectrum Analysis, mitigating interference from non-WiFi devices like microwave ovens and Bluetooth headsets.
AutoRF has always run quietly in the background. But now, our new Radio Settings page gives you more visibility into what’s happening behind the scenes, and exposes new controls for advanced configuration.
The new Radio Power selector either allows the Cloud Controller to automatically dial back transmit power if it detects adjacent access points stepping on each others’ toes, or allows you to maintain full power for all APs.
The Channel Planning Report sheds light on how AutoRF is tuning your network, providing visibility into the current channel and transmit power settings for each AP, as well as the interference sources that were avoided. If you click on the “Details” link next to each row in the table, you will find a detailed report for all of the APs in your network on a particular channel.
Regular users of the Cloud Controller will notice that some settings previously found under Network Wide Settings have moved to this page, where they fit naturally.
We hope that you find this Radio Settings page helps you better understand how the Cloud Controller is optimizing your network, and helps you to make more informed decisions about how to use the Cloud Controller’s RF controls. Please let us know what you like, what you don’t, and what you’d like to see next!
Last month we announced our new Traffic Shaper feature and gave administrators unprecedented visibility into the wireless traffic on their network, providing the ability to see what might be bogging down their network, be it YouTube, BitTorrent or too many users uploading pictures to Facebook. Now, with the new Traffic Shaper page in Dashboard, administrators finally have the tools to not only see what kinds of recreational applications are taking over their network but to do something about it!
Administrators can now create application-specific shaping policies for total control over their wireless bandwidth. Let’s say your Sales team needs snappy access to Salesforce.com at all times, but most of Engineering is streaming World Series games and consuming all of your bandwidth. With Traffic Shaper, shaping policies can be created that apply per user bandwidth limits for specific applications such as video streaming sites, as well as apply QoS priority levels at both Layer 2 and 3 to make sure your Salesforce traffic gets prioritized across the network.
To make setting up new shaping policies fast and simple, we have created pre-defined groups of applications that administrators most commonly want to shape:
Administrators can also create more specific policies for particular applications using HTTP hostnames (eg. salesforce.com), IP and port numbers. Here is an example of a typical shaping policy that you would see in an office setting:
In this example, a rule has been created to apply a 1 Mbps bandwidth limit to all users on the Meraki-Corp SSID for Peer-to-Peer and streaming video and music applications. A second rule has also been created to provide Layer 3 QoS prioritization to applications that are critical to this business, Salesforce.com and Dropbox.com, as well as to provide unlimited bandwidth to these applications.
Since Traffic Shaper can leverage the intelligence of over 16,000 customer networks through the Meraki Cloud Controller, Traffic Shaper’s database of application signatures is always updated. As new P2P and social media applications appear on the scene, they will be quickly fingerprinted and added to the Cloud Controller database for our customer networks so that administrators are never caught unaware by the next BitTorrent.
Traffic Shaper can now be found under the Configure tab in Dashboard. If you are interested in learning more about how Traffic Shaper works, we invite you to join us for a webinar that we’ll be conducting about Traffic Shaper on November 2nd. Details can be found here:
TEDGlobal 2010, themed “And Now the Good News”, wrapped up with some good news for Meraki and TEDGlobal attendees using the conference WiFi. As part of the British Telecom Sponsorship team, fellow Meraki engineer Robert Shanks and I were on site to deploy and support the wireless network for this 4-day conference. To make a long story short, the wireless network performed flawlessly, with just over a 1,000 people connecting throughout the conference and transferring over 250 gigabytes of data.
The conference venue, located in Oxford, UK, had its fiber backhaul brought in by BT. The backhaul was then distributed to wireless users in the two main venues of the conference, the Oxford Playhouse and the gala rooms of the Randolph Hotel, through fifteen MR14 dual-radio access points.
We leaned heavily on the Cloud Controller to quickly deploy the network with a small team. Rogue AP detection and automatic channel spreading maintained performance while TEDsters blogged, tweeted, browsed and streamed all at once. While we trusted the Cloud Controller’s real-time alerts to let us know about unexpected changes (there weren’t any), we also kept tabs on the network’s summary report, giving us a good understanding of the overall usage and performance of the network.
Along with performance and usage information, the summary reports confirmed that the device-of-choice for TEDsters was the iPad, with well over 100 using the network. In fact, hand-held devices accounted for over 50% of clients connecting to the network.
We had a great time at TED, and were happy to see the Meraki network being used so heavily. Thanks to the team at British Telecom for including us!
One of the most challenging aspects of managing large distributed networks is troubleshooting issues when the client is across town (or maybe even across the country!). Having on-site IT personnel 24/7 at even small satellite branch offices can require a very large IT staff and is too expensive for most organizations. Meraki networks offer a variety of “remote hands” troubleshooting tools, helping network admins diagnose and resolve many wireless connectivity issues without dispatching IT staff to the site. The ability to run diagnostic checks such as pinging an access point, running a throughput test from Dashboard, or reviewing detailed event logs have been integral to Meraki’s value for distributed networks and organizations with small IT staffs and large footprints.
We are now announcing a set of Live Client Tools that expose even more up-to-the-second information about who is on a wireless network, and further help troubleshoot connectivity issues. Administrators who log into their Enterprise network in Dashboard will notice several new and improved areas. On the Monitor > Overview page, there is now a new addition under the network name showing the number of clients that are associated at that moment:
If you click on the “More” link, you will see an expanded list with more information, including which SSIDs and channels the clients are using. This data is automatically refreshed as long as the “More” link is expanded.
Even cooler, Enterprise customers can change the access points map to show where clients are associated: click the “Options” menu on the map and select “Current clients.”
But the really interesting stuff is on the Access Point and Client detail pages. The Access Point detail page used to look like this:
Now, all of the live tools have been consolidated into a new, cleaner layout. Both Pro and Enterprise networks will benefit from the new layout. Enterprise networks now have two additional features in this area: Current Clients and Ping Client MAC. Clicking on the play icon next to Current Clients will pop up a list of all clients associated to that AP at that instant, including useful information about each client such as MAC, SSID, channel, signal strength, and how long they have been associated. Click on the name of a client to go to its client details page. You’ll even see clients that have associated, but not authenticated (they’re listed in grey). If you click the Ping link next to the client, you can actually ping that client in real time using ARP, as well as get additional information, such as RSSI changes over time and 802.1X identity (if appropriate).
The other new addition, Ping Client MAC, allows you to enter a MAC address and try to ping it. This can be very useful if you are trying to determine if a particular device is on your network at that moment.
There is also a new Live Tools section on the client detail page. From this page you can also ping that individual client, but there are a few additional new tools:
The Locate Client tool allows you to find out whether that client is associated on your network at that moment, and if so, where they’re associated and for how long:
Finally, the Packet Counter tool shows a real-time count of received and sent packets to that client. You can actually see the packet counters roll as you ping the client!
We think these new tools further improve Meraki’s uniquely clear approach to distributed, multi-site network management, a normally challenging task. Network administrators can more quickly resolve their wireless users’ connectivity issues and access accurate real-time data about the exact state of their network.
Meraki’s cloud-based architecture makes it an ideal choice for distributed, multi-site systems of networks, with administrators able to manage up to 1,000 networks from a single web browser using Dashboard. We’ve recently added a feature that makes it even easier to visualize and manage geographically distributed networks. Users who have logged into Dashboard in the last day may have noticed a new link above the network name on the Monitor > Overview page:
The link is the name of the organization that contains the network. (The network selector at the top of the page groups your networks by organization. Many of our network administrators have just one organization, but it’s not uncommon to have more — one for Enterprise networks and one for Pro networks, for example.) Clicking on this link will take you to a new page, the All-Network Overview page:
This displays all of an organization’s networks on single map. These networks are listed at the top of the screen, along with color coded markers so that each network can be easily located on the map below. The usage graph displays cumulative usage across all listed networks. If you mouse over a particular network name, that network’s usage is highlighted on the usage graph, and its network markers are highlighted on the map below.
Jump to a network’s overview page by clicking its name, or jump to a particular access point in any of your networks by double-clicking its marker. If you’d like to see all your networks’ access points color-coded by status, that’s easy too: just uncheck “Color by network” on the map’s Options menu.
You can also get to the All-Network Overview page by choosing “All-network overview” from the network selector:
The All-Network Overview page is available today to all Meraki network administrators with two or more networks. This is a great tool to assist with managing large, multi-site deployments and we are very excited about this new addition to Dashboard.
Meraki administrators utilizing per-user bandwidth limitations now have a new tool at their disposal to ensure that their wireless users have the best possible experience while preventing any one user from hogging bandwidth. Introducing SpeedBurst, a new feature that allows users to temporarily exceed their bandwidth limit at the beginning of a download while staying within assigned limits over time. This makes downloads feel speedier and network performance snappier.
You can enable SpeedBurst by using the checkbox that can be found under Configure -> Access Control in the Bandwidth Limit section (see screenshot below). The checkbox will be grayed out if bandwidth limits are not in use.
SpeedBurst is a great for guest access or event networks where end user experience is critical while at the same time equal network performance for all users is required. We’ll be rolling out SpeedBurst to Enterprise and Pro Meraki networks starting today.