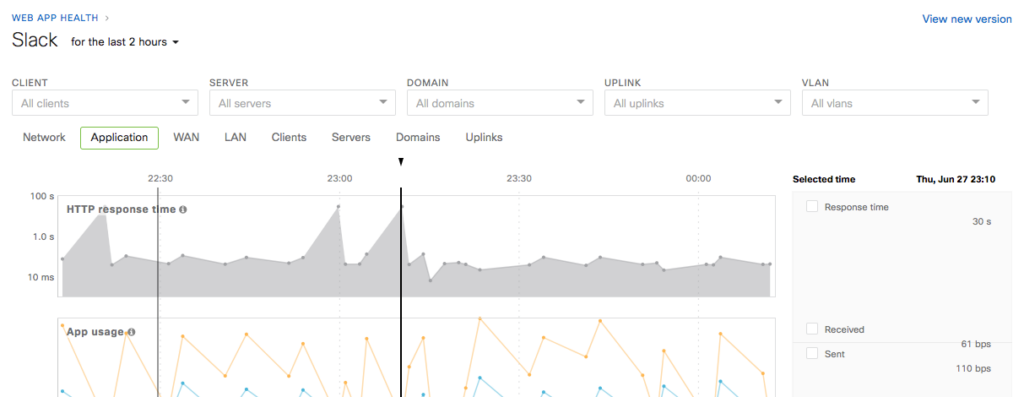
On Friday afternoon, you might have experienced Slack running (a lot) slower than usual. If so, you were not alone. Many people on the Internet noticed that Slack messages and notifications were slightly delayed.
As always, Meraki Insight detected this issue in real time. Network engineers who were using MI could easily identify the root cause of the problem (hint: it was not the network).
The first sign of trouble was an alert.
If you click on the alert link for further information, you will see that the response time for Slack exceeded 30 seconds (!!) several times during the day.

Finally, MI makes it really simple to identify who is affected. In this case, it turns out that only a few Slack servers were affected, and one domain was especially slow. As a result, not all clients/users were affected, and even those that experienced slowness likely only saw some features working slowly, while the others worked as expected.

(Domains)

(Clients)
Sure enough, later in the day, Slack came out with more details.
In particular, Slack noted that “During this time, approximately 10-25% of jobs resulted in errors or failure. By 10:00 a.m. PDT, we fully restored message delivery and reduced the error rates to less than 5% as the team continued to work on a full recovery.”
An engineer that was using MI would have easily diagnosed this problem in real time and identified why some users were affected while others were not, before Slack posted details of their outage.
Take a deep dive of Meraki Insight by signing up for a webinar.