In celebration of spring, we’ve added some new colors to Meraki
Dashboard’s device pages. Our connectivity graphs now show much more
information about device status through time. In particular:
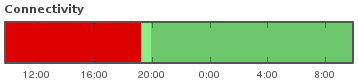
- Gateway devices, which are connected directly to the Internet,
appear as darker green. A device with an intermittent Internet connection may
change shade as it switches between repeater and gateway. For example,
this node came online at around 19:10, but its Internet connection came up
about an hour later:
- New orange and yellow colors show times when a device can reach
Dashboard, but cannot be used by clients. This can happen, for instance,
when your upstream DNS server appears down, or when repeaters can’t find a
gateway in your network.
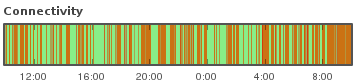
In summary, green shows when devices are usable by clients,
orange and yellow show when devices are unusable by clients but can
reach Meraki, and red shows when devices cannot even reach Meraki.
Different shades distinguish between gateway and repeater and other
important states. If you forget what a color means, move the mouse over a
large connectivity graph and a tooltip will tell you.
This functionality depends on our latest firmware, so you may not see
the new colors until your network automatically upgrades. We hope this
more detailed information will help you debug your network faster and
easier.
– posted by Eddie Kohler