Getting Started With Cloud Monitoring for Catalyst
Follow this simple three-step process to create a free Meraki dashboard account and onboard your devices.
GET THE GUIDE
Start your journey today.
Gather device information
To get started, you’ll need your Catalyst device credentials handy (SSH username and password, device IP addresses, and ports).
Set up the Meraki dashboard
Next, set up or log into your Meraki dashboard account. Enable and grab your API key from Organization > Settings > API access.
Onboard your
devices
From Organization > Inventory, download and run the Catalyst onboarding app. That’s it! After the onboarding process is complete, head to the switches section of the dashboard to see topology, clients, traffic, and more.
Supported Catalyst hardware
Cloud monitoring through the Meraki dashboard is supported on the following Catalyst hardware:
- Catalyst 9200/L series
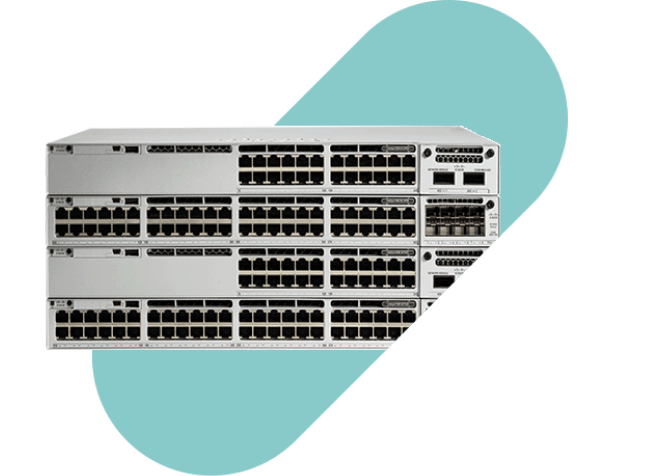
- Catalyst 9300/L/X series
- Catalyst 9500 series
- Running IOS-XE versions 17.3.x to 17.8
Looking for more? Check out the full Onboarding Guide.

A cloud-based platform with real management experience.
View network topology
In the Network-wide tab, check out Monitor > Topology to see the map of all your connected devices.
Track clients and traffic
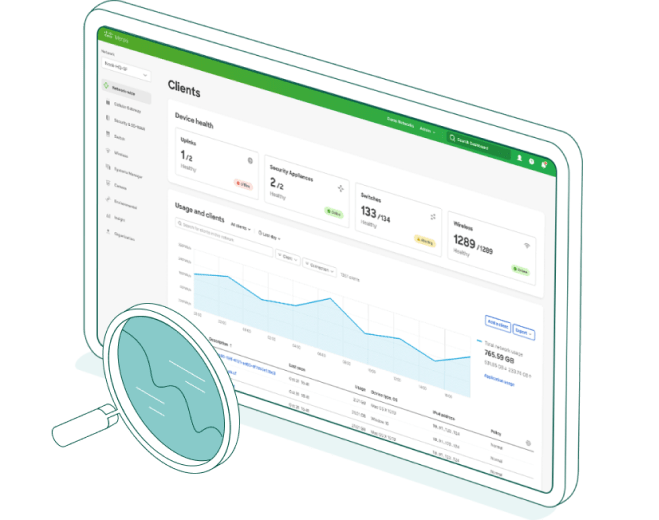
Speaking of traffic, get detailed telemetry on every client connected to your network.
Monitor switch
status
The list of switches not only shows every device, but also shows critical status details in a single view.
Troubleshoot from miles away
Connection trouble? Cycle and ping the port from anywhere on the planet.
Inspect port
details
Click into any Catalyst switch and see information about real-time port status, stacks, and config.
Don’t worry, get “appy”
See any applications running on the network and track down the owner, fast.
Want to learn more?
Join the Meraki Community today. Find answers, ask questions, and connect with a community of cloud-management aficionados from around the world. Sign in with your Cisco account and accelerate your journey to the cloud.


