If you’re in charge of your organization’s network infrastructure, you know that keeping tabs on the health of your network can be a draining, 24/7 job. Round-the-clock visibility into your network is paramount, and supporting a growing environment demands ever-improving sophistication, intelligence, and awareness. At Cisco Meraki, we are continuously striving to set the standard for real-time network performance visibility with our AI-powered intelligence dashboard.
Advanced web application insight
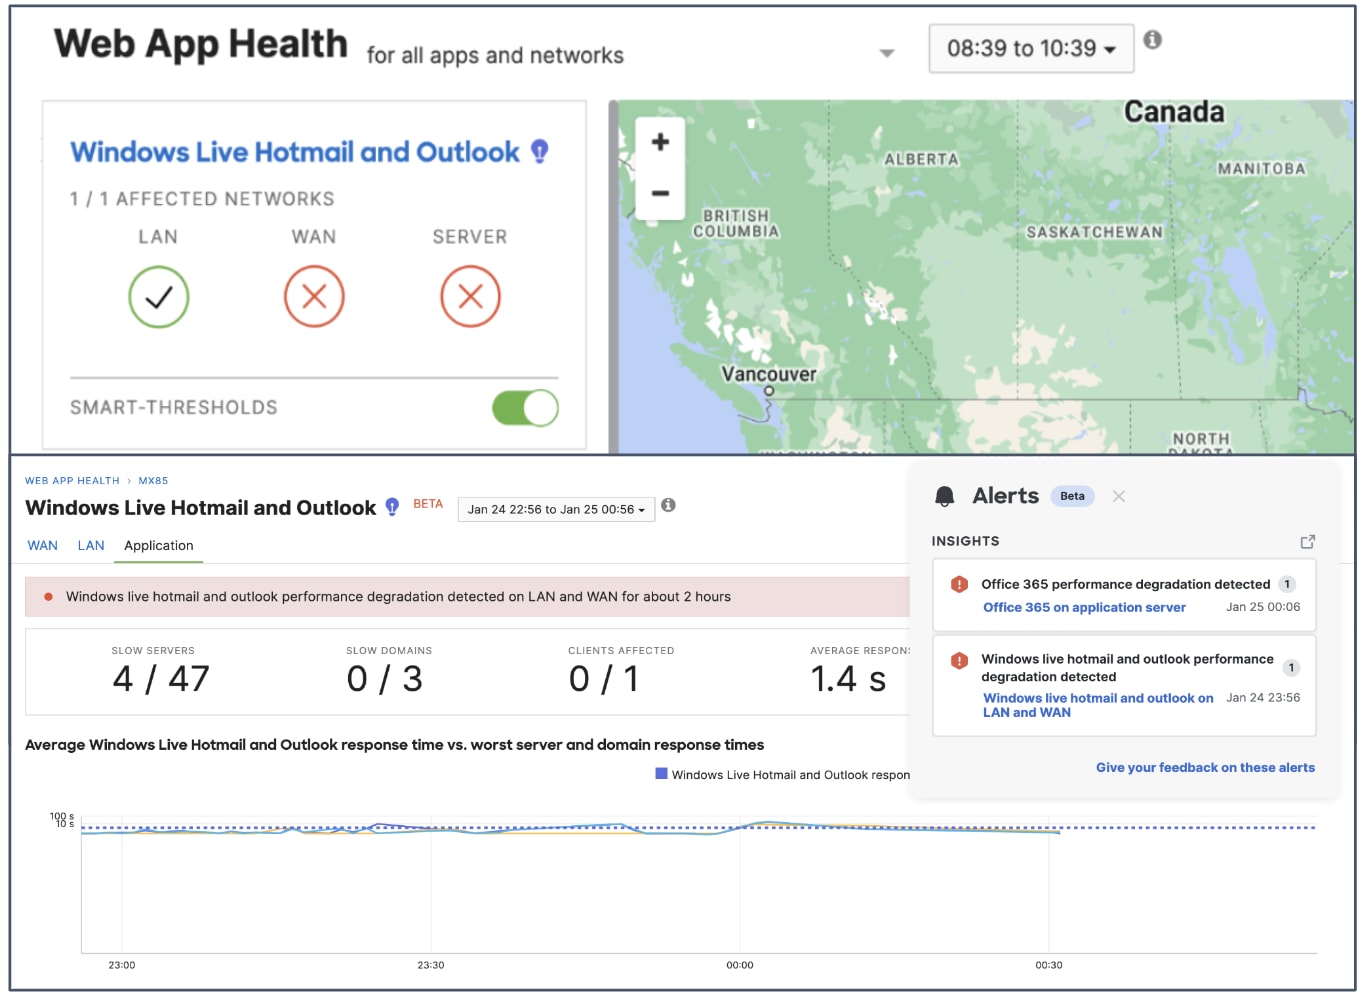
With Meraki Health, we give administrators real-time visibility into the performance of their networks, and one key feature is the Web App Health tool, which allows you to:
- Monitor the availability and responsiveness of your web applications and track performance over time
- Analyze the root cause of performance problems with your web applications by identifying specific issues
- View detailed reports and analytics on the health of your web applications, including trends, anomalies, and historical data
As an example, in the past few weeks, the Web App Health tool immediately identified a critical Outlook 365 network outage for a Meraki customer. Without that advanced insight, the IT administrator would have been unable to identify and troubleshoot the critical outage, highlighting the importance of real-time network monitoring.
Streamlined visibility
A robust, critical issue detection tool like Web App Health is essential to understanding your network’s performance. However, if the issues or alerts detected are unclear or difficult to interpret, it limits the efficacy of our AI-driven tools. That’s why we continue to advance the already intuitive and streamlined Meraki health dashboard.
One recent innovation in this area is the launch of the Organization Alerts page, which provides a centralized view of all alerts across an organization, making it easier to manage and respond to them. This feature allows administrators to customize how they receive alerts so they can choose the method that works best for their workflow and create custom rules to trigger alerts for specific events or situations.
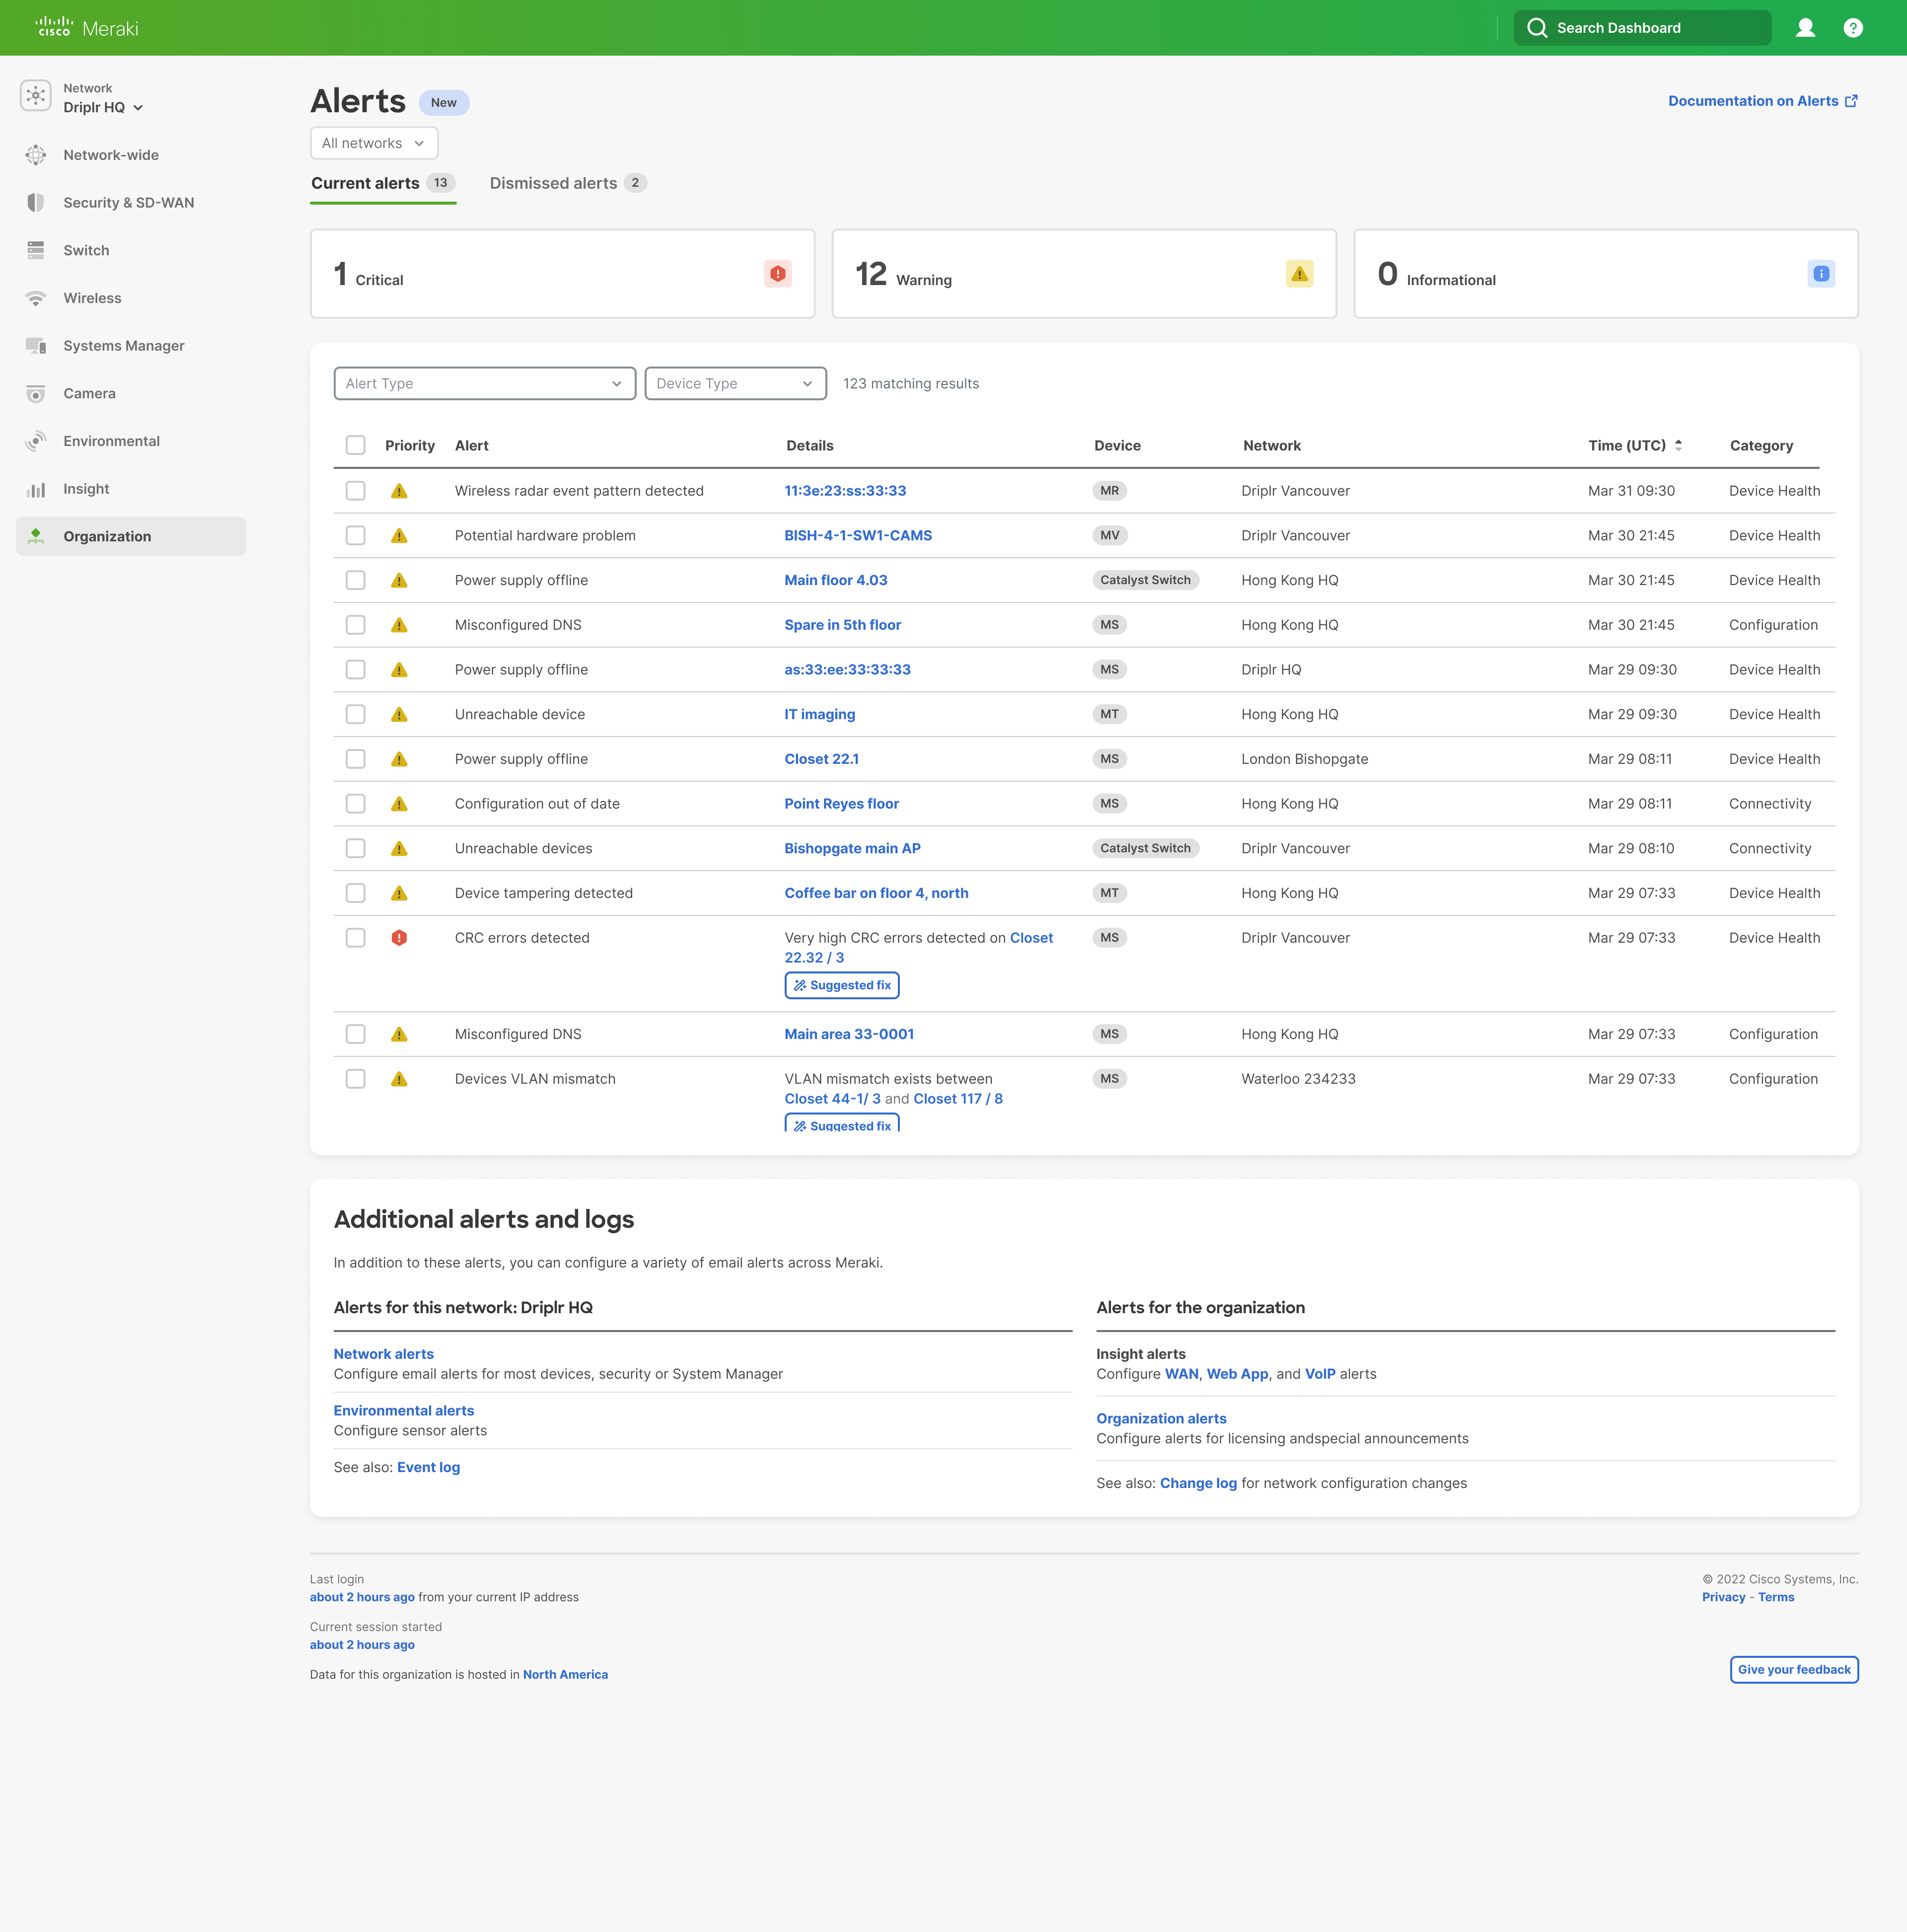
The Organization Alerts page and assortment of other intuitive, centralized management hubs in the Meraki dashboard can provide you with a comprehensive view of your network infrastructure.
Customer-focused innovation
Our team is constantly innovating with customers in mind, providing new features and capabilities that address the real-world challenges you face today and will continue to face in the future.
By integrating practical AI and machine-learning algorithms, the Meraki Health dashboard is continuously learning and improving to provide more real-time insights into server performance, proactive monitoring, network roaming, and many new features to come.
We’ve got your back
No matter your experience level with network management, Meraki Health has your back. With powerful tools like Web App Health and the Organization Alerts Page, you can intuitively keep your network running smoothly and efficiently. Additionally, with a variety of customer-focused AI-driven tools launching soon, the Meraki Health dashboard will continue to offer ever-improving network intelligence to you, our rockstar customers. Learn more about all of our dashboard innovations!