AutoVPN is a unique feature of Cisco Meraki MX Security Appliances that allows secure connections to be established between remote branches within seconds, and it’s one of the most common reasons customers have for choosing to deploy MXs. Because visibility is an important part of the Meraki management experience, we also provide a comprehensive VPN status page to monitor the health and connectivity of AutoVPN connections, exported subnets, and overall cloud connectivity.
Now we’ve taken it a step further by completely redesigning how we present this information to you — adding some new enhancements that allow you to quickly retrieve important information about your VPN deployment.
Seamless access to usage and performance metrics
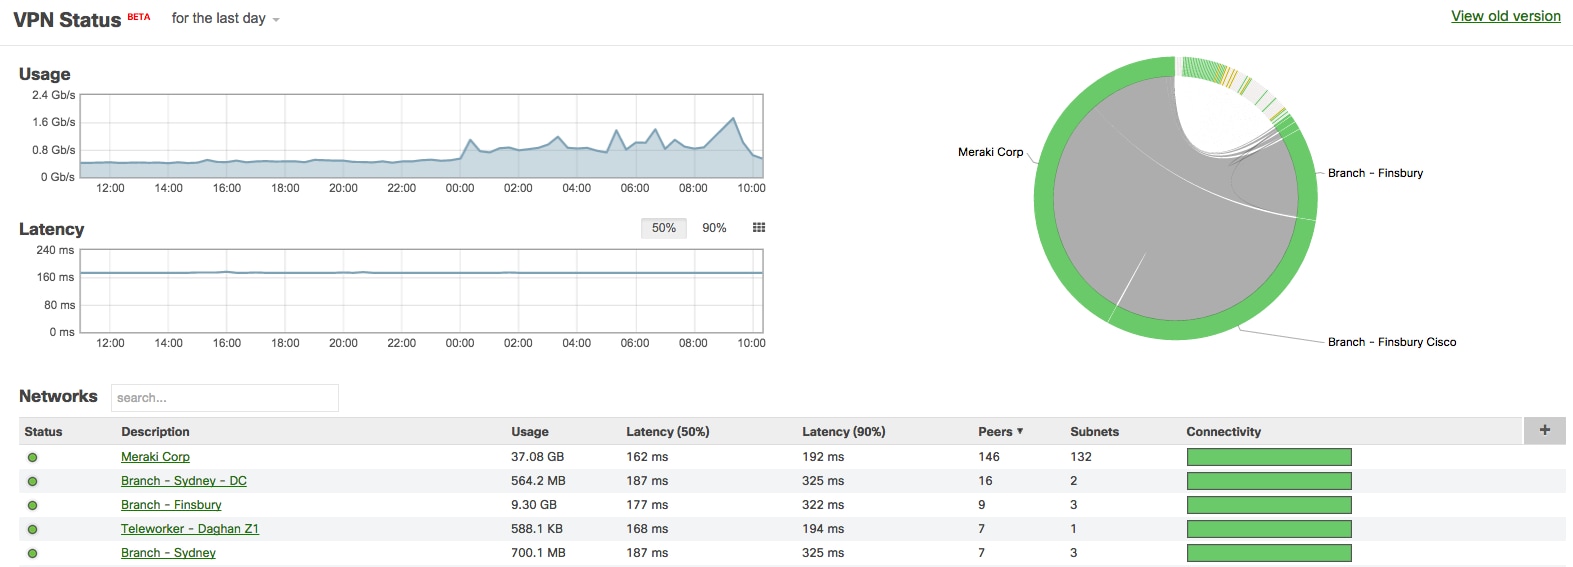
First, the entire status page has been redesigned with a focus on easy visibility into key metrics like tunnel latency, VPN usage, number of subnets exported, site connectivity, and more:
In the main status view, a user is presented with a full list of VPN networks along with statistics on usage and tunnel health.
In the ring view, each band of green on the outer ring represents an MX Security Appliance deployed at a given site. The band length is based on the amount of VPN traffic to or from that site. Wide green segments indicate MX networks that send and receive larger amounts of VPN traffic than thinner segments. Often “wider” sites have more VPN peer connections than “thinner” sites, but not always.
Below, we can quickly see that the MX highlighted has a high amount of VPN peer density (it’s connected to multiple MXs at other sites), and is one of the major hubs for VPN traffic.
Hovering over another peer MX within the same VPN network, however, shows a different story.
With this particular peer, we see there are two primary VPN connections: one to the heavily-trafficked site we just looked at, and another to a second MX with which it has far less VPN traffic.
New latency measurements for troubleshooting and failover
Another useful addition is the reporting of latency metrics for enhanced visibility into delays in packet delivery over the VPN. Many factors can contribute to latency: physical distance, malicious activity, network misconfiguration, or just plain old congestion during peak times of day. Unlike the point-in-time latency data on the existing VPN status page, this new latency information lets you identify patterns over time, which you can then use to pinpoint troublesome peers, applications, or users.
Convenient per-site review
Finally, you can also view statistics for a specific site and its peers. These statistics include latency and usage for all directly connected VPN links, the number of exported subnets, and any non-Meraki peer connections. Best of all, this is all available from a single view.
Overall, these enhancements provide more intuitive visibility into the health and connectivity of VPN networks, which helps to streamline VPN configuration, management, and troubleshooting.
You can try the new view for yourself by clicking the link in the “check out the new version of this page” banner on the VPN status page in your dashboard. We’d love to hear your thoughts on the new page, so please let us know what you think by making a wish in Dashboard, using the feedback tool that appears when you switch back to the old version of the page, or reaching out to us on Twitter or Reddit!